In this second post of the series “PRACTICAL EXAMPLES WITH FRIDA – Frida VS Anti-Debug Techniques on Windows” we will start with showing examples of bypassing anti-debug techniques. As announced in our first post, in this entry we will talk about the first group of anti-debug techniques: “Techniques based on system calls”.
These techniques use system calls to determine if a process is being debugged by using either functions that provide this information directly, like IsDebuggerPresent, or functions that provide this information indirectly, like FindWindow. Software can use a lot of methods, using these calls, to determine if it’s running under debugger supervision. This kind of functions have in common that they can be found by Frida using Module.findExportByName(null, exportName), and then intercepted, making their instrumentation easy.
In this post we will discuss the techniques based on the following system calls: IsDebuggerPresent, NtQueryInformationProcess and CreateToolhelp32Snapshot. All of them enable us to see how to use Frida in different ways with the objective to bypass these controls.
IsDebuggerPresent
The first check we will try to bypass is a method based on the system call IsDebuggerPresent. As it is indicated in Microsoft documentation, this function does not receive any parameter and returns a boolean value depending on whether the process is being debugged: a return value of “True” means that the process is being debugged and “False” means the opposite. To illustrate this method we have developed a simple program that performs debugging detection using this system call:
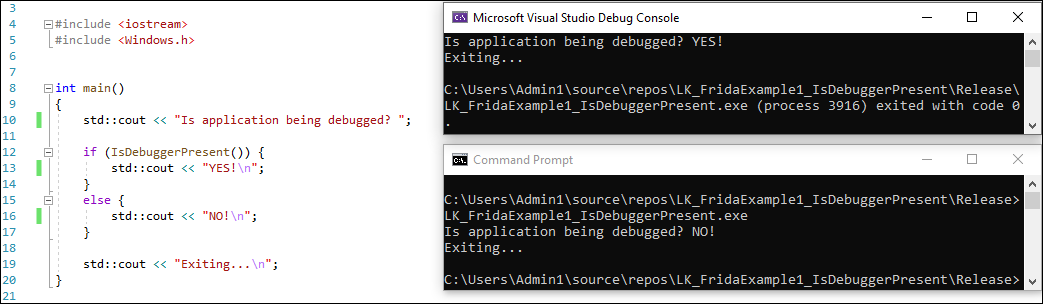
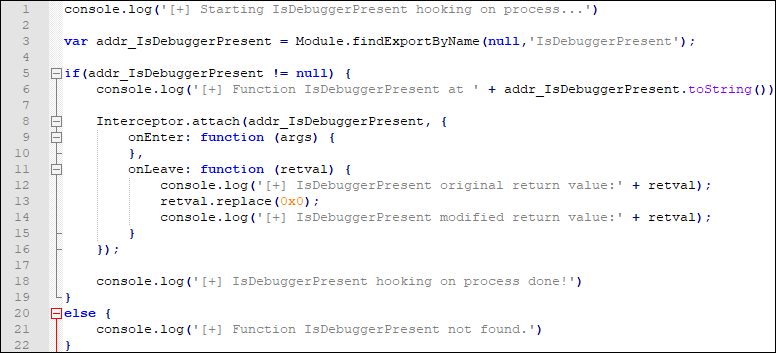
In the first console, we see how the application indicates that it is being debugged when we execute it from Visual Studio. However, if the application is being executed directly from a terminal, it indicates that it isn’t being debugged. Another way to check this fact could be executing it from a debugger like x64dbg. The only thing that is used to make the decision is the value returned by the function IsDebuggerPresent, therefore, we should develop a script with Frida that intercepts this call and modifies the return value, returning False (0x0) always. The script that follows was developed to do all that:
- Firstly, it locates the address of the function “IsDebuggerPresent” using Module.findExportByName (line 3).
- Once this address is obtained, it intercepts this call using Interceptor.attach(…) (line 8).
- Finally, it replaces the return value by 0x0 (False) just before the function ends (line 13).
NtQueryInformationProcess
The second system call that we will show is NtQueryInformationProcess. This function lets us obtain different information related with a process. It is more complex than the last one, since it allows us to select the information to query using the ProcessInformationClass parameter, and it will give us this information on the ProcessInformation parameter.
In this example we will show how to bypass 4 checks, each one using a different value of ProcessInformationClass. These values are: ProcessDebugPort, ProcessDebugFlags, ProcessDebugObjectHandle and ProcessBasicInformation.
- ProcessDebugPort (0x7)
This class is used to obtain the debugger’s port number, if there is any debugger attached. This value will be different from 0 if a debugger is attached. - ProcessDebugFlags (0x1F)
Using this class we could retrieve a flag that would give us information about the existence of an active debugger. In this case, if the value returned in the ProcessInfomation parameter is 0, it indicates that the application is being debugged.
- ProcessDebugObjectHandle (0x1E)
Indicating this value as ProcessInformationClass, this system call will return a valid Handle only if the process is being debugged.
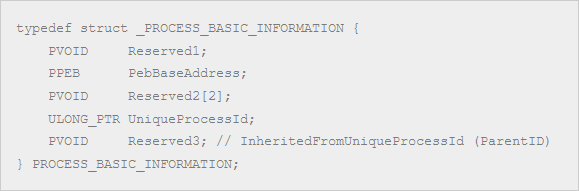
- ProcessBasicInformation (0x0)
Using this class we obtain in ProcessInformation parameter an struct called PROCESS_BASIC_INFORMATION that includes, among other data: a pointer to PEB struct (offset 0x4), the PID of the process (offset 0x16) and the parent’s PID (offset 0x20). One anti-debug technique that software could apply using this information is to get the name of the parent process using the parent’s PID and checking it against a list of well-known debugger names.
As above, we develop a small C++ application that shows an example of this technique. To evade these checks, we must develop a script using Frida that must do the following operations:
- Firstly, it must locate the address of the function “NtQueryInformationProcess” using Module.findExportByName.
- Then, it must intercept the function call using Interceptor.attach(…).
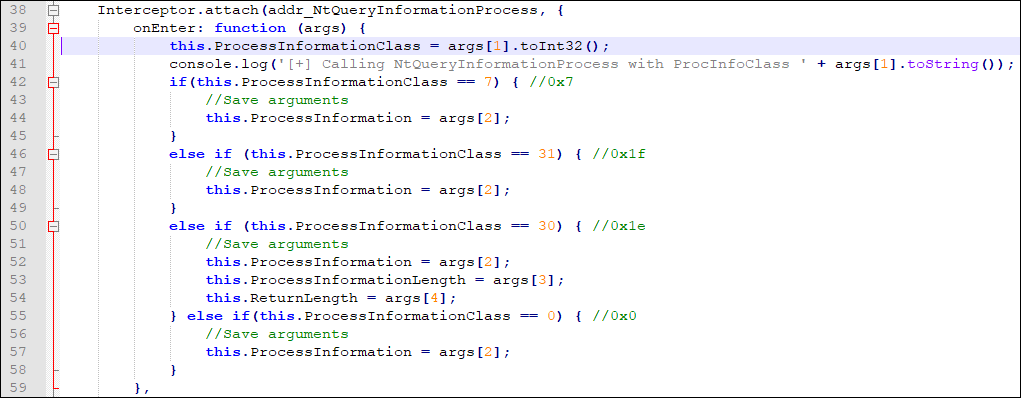
- Each time that the function “NtQueryInformationProcess” is called (OnEnter), the script must do:
- Save the parameter ProcessInformationClass, allowing us to select what return information must be modified (line 40).
- Save the pointer to the return parameter ProcessInformation (lines 44, 48, 52 y 57).
- Save, also, the arguments needed in each case.
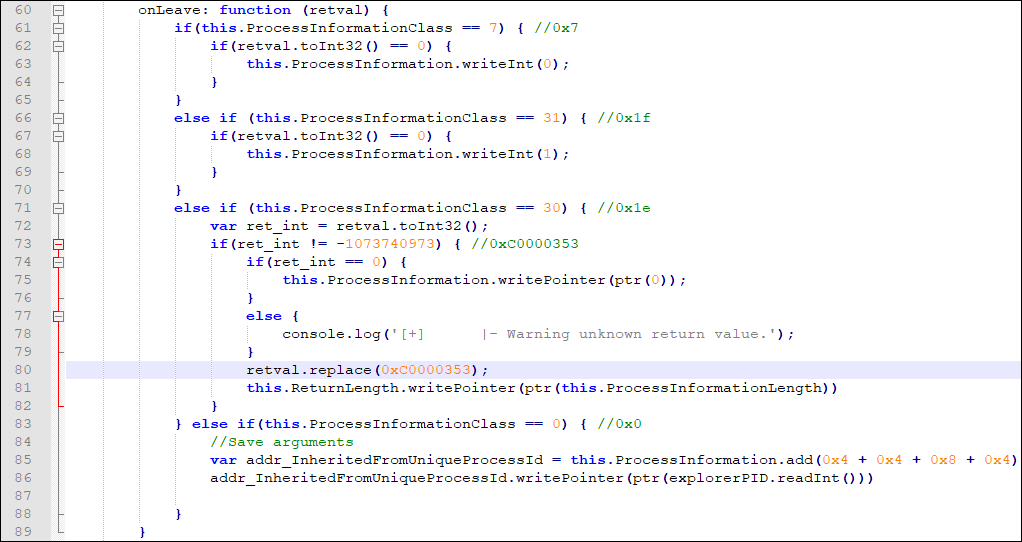
- Finally, just before the function ends (OnLeave), the script can use the previously saved information to determine what value needs to be returned using the parameter ProcessInformation. Depending on this.ProcessInformationClass we should return the following values:
- 0x7 (ProcessDebugPort), ProcessInformation will be replaced by the value 0x0 (line 63).
- 0x1F (ProcessDebugFlags), ProcessInformation will be replaced by the value 0x1 (line 68).
- 0x1E (ProcessDebugObjectHandle), in this case, we will check the return value and, if it is successful, the parameter ProcessInformation will be replaced by 0x0. The parameter ReturnLength will also be replaced (lines 72 – 81).
- 0x0 (ProcessBasicInformation), finally, if this option is selected, we should know the PROCESS_BASIC_INFORMATION struct to replace the parent’s PID (InheritedFromUniqueProcessId, offset 0x20) by a non suspicious PID, like the PID of the process ‘explorer.exe’.
To obtain the PID of the process ‘explorer.exe’ using Frida we can use Windows API calls, for example, the functions GetShellWindow and GetWintowThreadProcessId. We can declare these functions via Javascript using NativeFunction del API de Frida and, once they are declared, we can use them to obtain the process PID as we show below:
| var addr_GetShellWindow = Module.findExportByName(null,’GetShellWindow’); var addr_GetWindowThreadProcessId = Module.findExportByName(null,’GetWindowThreadProcessId’);var fun_GetShellWindow = new NativeFunction(addr_GetShellWindow, ‘pointer’, []); var fun_GetWindowThreadProcessId = new NativeFunction(addr_GetWindowThreadProcessId, ‘pointer’, [‘pointer’, ‘pointer’]);var explorerWindow = fun_GetShellWindow(); var explorerPID = Memory.alloc(0x4) fun_GetWindowThreadProcessId(explorerWindow, explorerPID); console.log(‘[+] Explorer PID: ‘ + explorerPID.readInt()); |
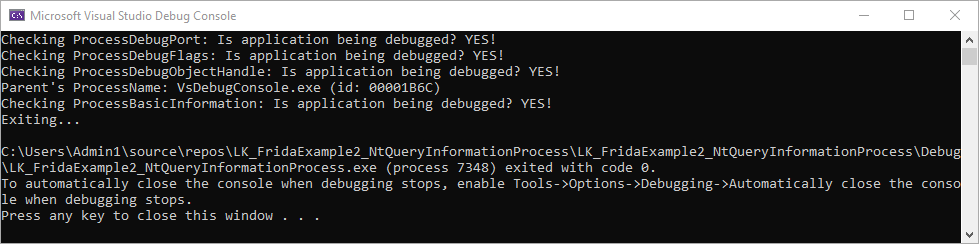
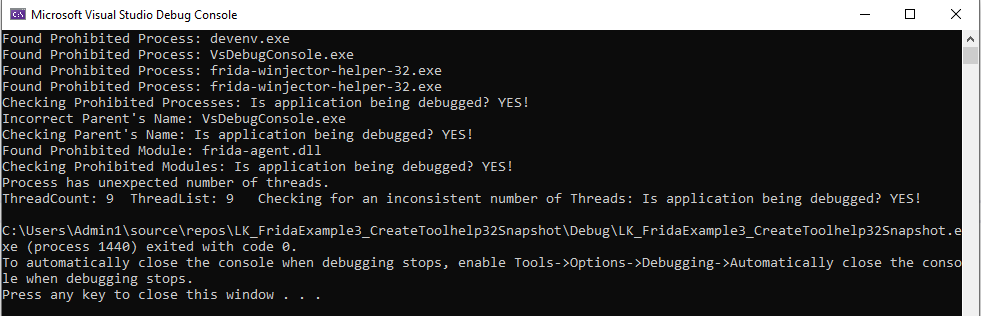
Executing this example program with Visual Studio Debugger, we get the following result:
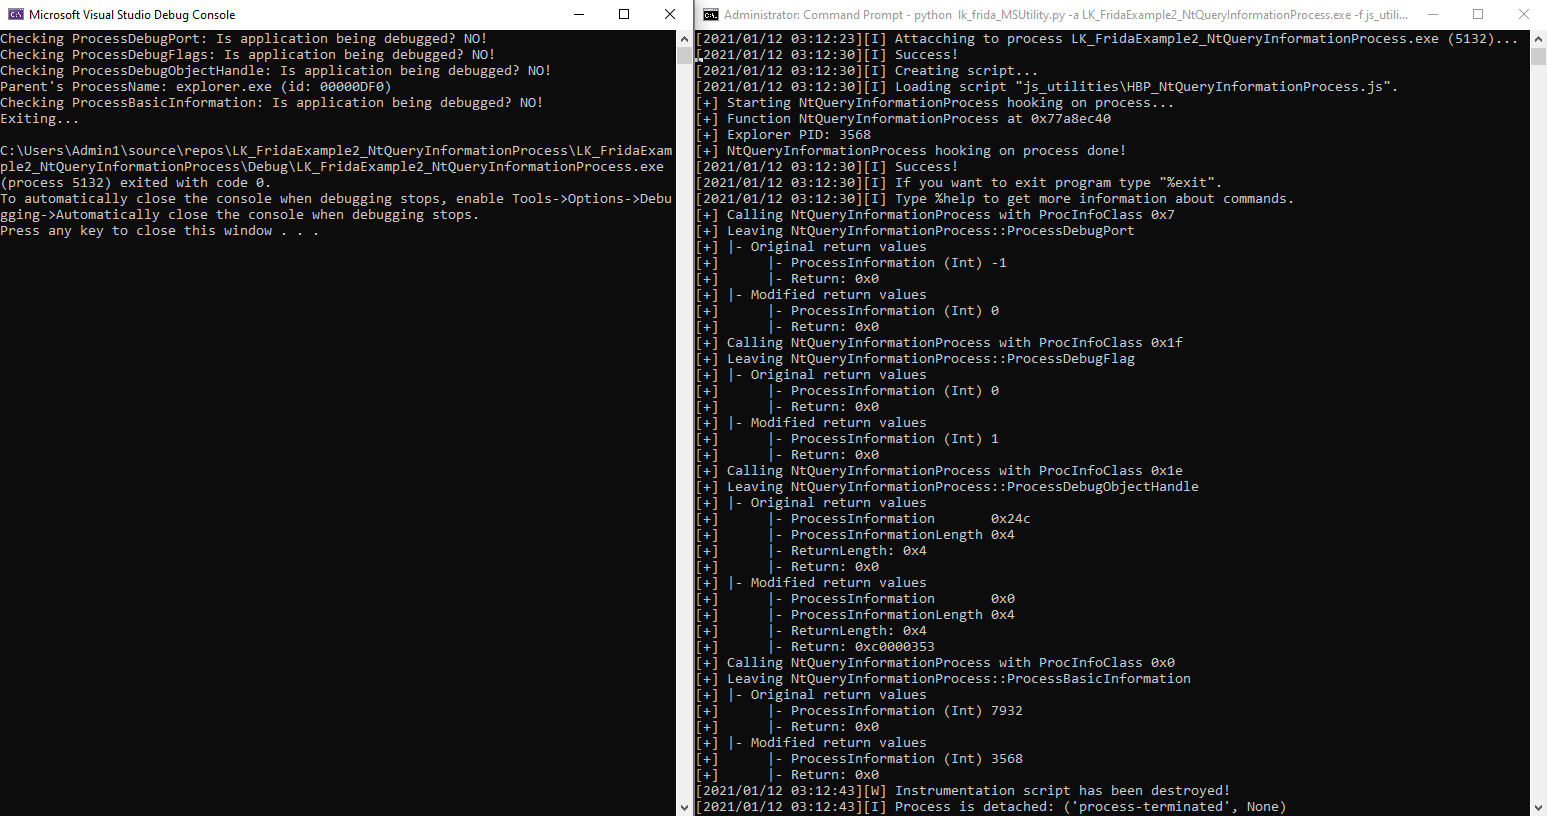
If we execute the same application with the same debugger, but injecting the script of Frida described before, we get this other result:
CreateToolhelp32Snapshot
To complete this post, we will talk about the function CreateToolhelp32Snapshot. The most common anti-debug technique using this function is to verify the process parent’s name and PID, identifying if the parent is a well-known debugger, but this function can also be used with other purposes. First of all, this function creates an snapshot that contains some system information about processes, threads and modules. The information of this snapshot can be selected using the first argument. The following values are allowed: TH32CS_INHERIT, TH32CS_SNAPALL, TH32CS_SNAPHEAPLIST, TH32CS_SNAPMODULE, TH32CS_SNAPMODULE32, TH32CS_SNAPPROCESS, TH32CS_SNAPTHREAD.
The most basic anti-debug technique using this function is to use only TH32CS_SNAPPROCESS to get the list of running processes. Then, look up our process, identifying our process parent’s PID, and, then, look up the parent process’ information in the list. Finally, verify the information of the parent process. However, with the information given by the function using different flags (or using TH32CS_SNAPALL) we can perform other verifications. For example:
- Processes related verifications (using TH32CS_SNAPPROCESS):
- Search for prohibited processes (like VsDebugConsole.exe, devenv.exe, x32dbg.exe…) over the whole list, regardless of whether the process is related or not.
- Modules related verifications (using TH32CS_SNAPMODULE and TH32CS_SNAPMODULE32):
- Search for prohibited modules (like frida-agent.dll…) over the module list related with my process.
- Threads related verifications (using TH32CS_SNAPTHREAD):
- Verification that all Threads listed have an associated process, trying to detect hidden processes.
- Verification of the application thread count.
- Verification that there aren’t any threads of my application that reference a prohibited module.
As you can see, an application, using this function, can verify different things that must be consistent among them. Our task, then, to bypass these checks, must be to find a workaround that allows us to bypass all these checks and keep the consistency of the list. With this objective, we studied what information is exactly returned by this function and how we can manipulate it.
The function CreateToolhelp32Snapshot return a HANDLE of type SECTION. If we analyze the memory section pointed by the HANDLE we can find a non-documented structure with the following parts:
Snapshot Header |
* The names and types of this section have been assigned by the author of this post because no related documentation has been found. | |
| DWORD dwHeapListCount; | Heap List element count. | |
| DWORD dwProcessListCount; | Process List element count. | |
| DWORD dwModuleListCount; | Module List element count. | |
| DWORD dwThreadListCount; | Thread List element count. | |
| DWORD dwHeapListOffset; | Offset (from the section’s base) where Heap List is located. | |
| DWORD dwProcessListOffset; | Offset (from the section’s base) where Process List is located. | |
| DWORD dwModuleListOffset; | Offset (from the section’s base) where Module List is located. | |
| DWORD dwThreadListOffet; | Offset (from the section’s base) where Thread List is located. | |
| DWORD dwHeapListIndex; | Index used by Heap32ListFirst and Heap32ListNext functions. | |
| DWORD dwProcessListIndex; | Index used by Process32First and Process32Next functions. | |
| DWORD dwModuleListIndex; | Index used by Module32First and Module32Next functions. | |
| DWORD dwThreadListIndex; | Index used by Thread32First and Thread32Next functions. | |
Heap List |
Array of HEAPLIST32 elements. | |
Module List |
Array of MODULEENTRY32 (or MODULEENTRY32W) elements. | |
Process List |
Array of PROCESSENTRY32 (or PROCESSENTRY32W) elements. | |
Thread List |
Array of THREADENTRY32 elements. | |
We can use the functions NtQuerySection and NtMapViewOfSection to modify the memory related with Handle, thus modifying the contents of the snapshot returned by the function CreateToolhelp32Snapshot. So we can develop a Frida script that modifies the lists returned by CreateToolhelp32Snapshot, hiding the Processes, Modules and Threads that could be checked to detect the debugger, but keeping its consistency.
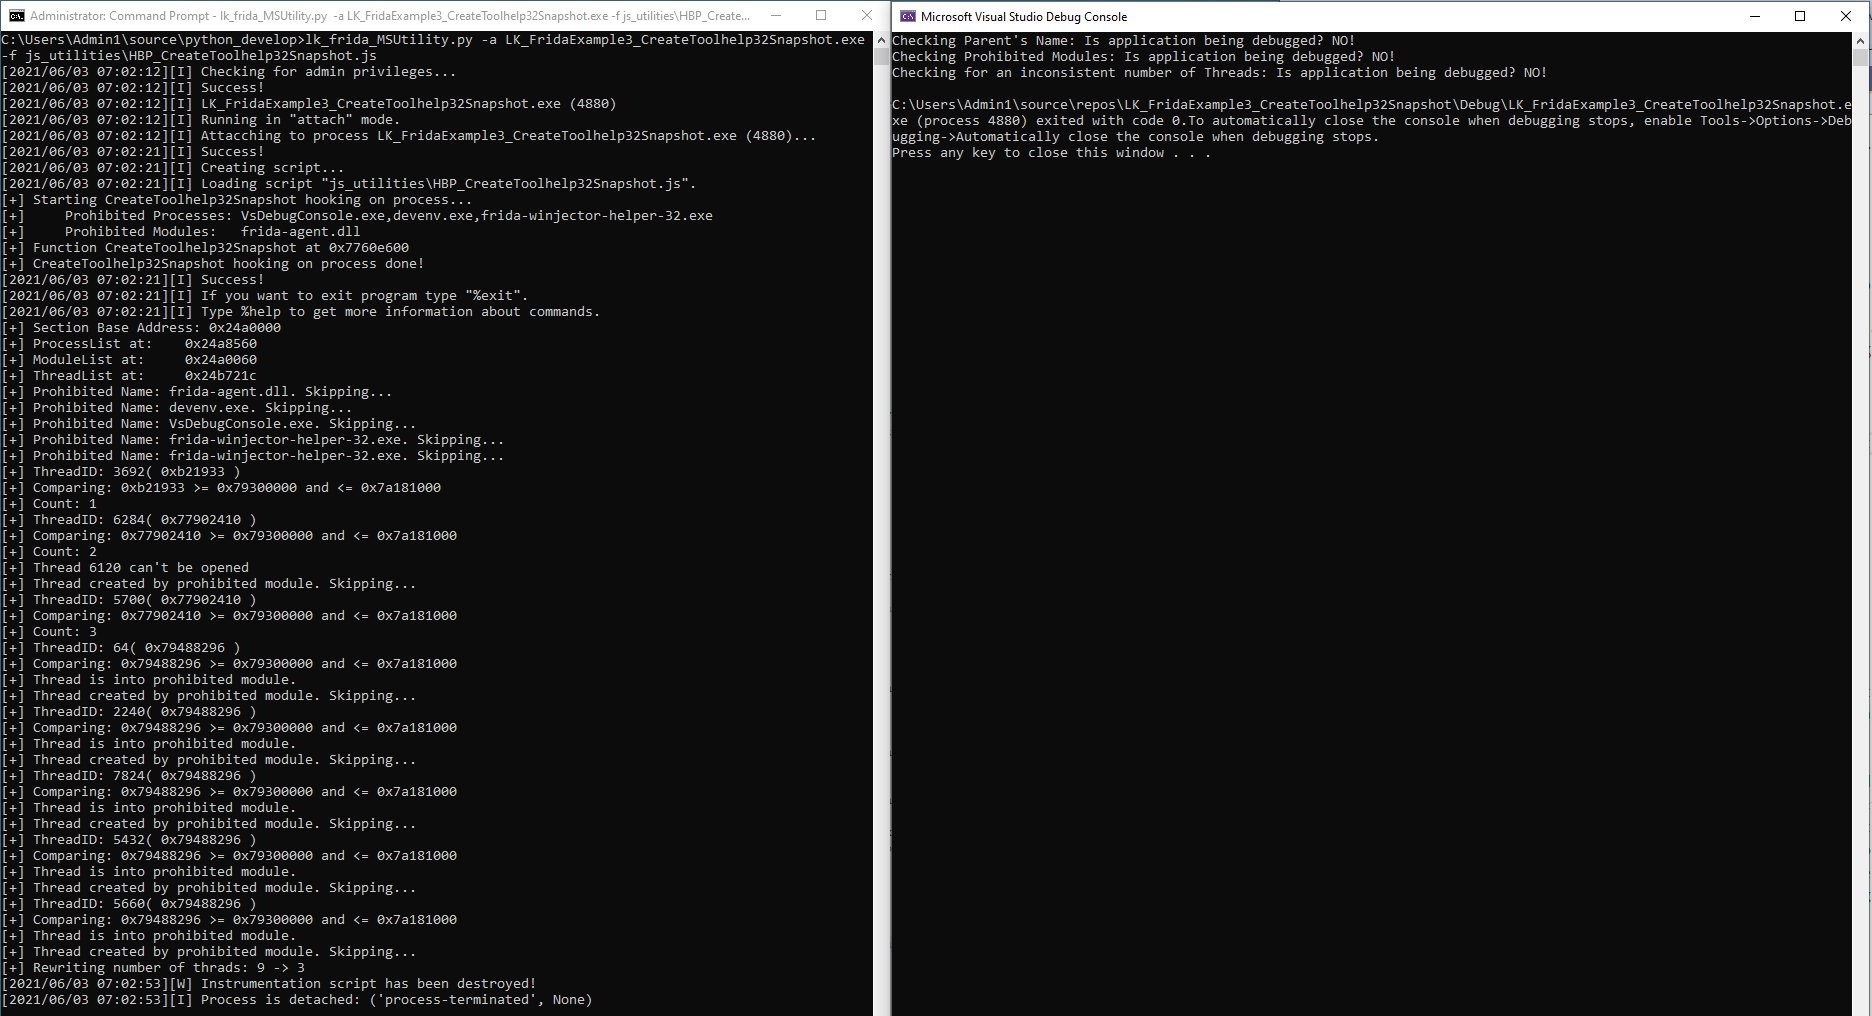
First of all, we should define a list of processes and modules that should be hidden. We need to known their names. In this example, we will hide Visual Studio Debugger and the executable and modules related with Frida. So we define 2 lists with the following content:
- Prohibited Processes list: VsDebugConsole.exe, devenv.exe, frida-winjector-helper-32.exe
- Prohibited Modules list: frida-agent.dll
Once we are sure which processes and modules we want to hide, we are going to hook the function CreateToolhelp32Snapshot as we did before. In this case, we don’t modify any parameter or return value. We are going to intercept the Handle that will be returned by the function just before the function returns it and execute some code before the return takes place. As we saw before, using the functions NtQuerySection and NtMapViewOfSection, we are going to locate the memory related with the Handle and we will perform the following steps:
- Process List modifications:
- We should remove from the list of processes those that are found in the list of prohibited processes.
- We should remove the references to prohibited processes, to keep the consistency.
For example, the program that we will be debugging will probably have a prohibited process as parent. Therefore, we should change the Parent’s PID value to the PID of a non suspicious process (like explorer.exe PID).
- Module List modifications:
- We should remove from the list of modules those that are found in the list of prohibited modules.
- Thread List modifications:
- We should delete from the list of threads those that are owned by a process deleted in the Process List.
- We should delete from the list of threads those that point to a module deleted from the Module List.
We can get this information by using the functions OpenThread, with THREAD_QUERY_INFORMATION permission, and NtQueryInformationThread, asking for ThreadQuerySetWin32StartAddress. Comparing the information obtained by this query with the memory associated with prohibited modules we can determine if the thread should be removed from the list or not.